Gold and silver prices suffered their steepest single-day declines in more than a decade on October 21, erasing billions in market value and igniting debates among investors over whether the precious metals are poised for a deeper correction reminiscent of past market upheavals.
Spot gold tumbled as much as 6.3% to $4,082 per troy ounce, its largest daily drop since September 2013, after touching a record high of $4,381 earlier in the week. Silver fared worse, plunging 8.7% to $47.89 per ounce—marking the biggest one-day fall since March 2021—following a surge to $54, its highest level in over a decade. The sell-off extended into Wednesday, with gold dipping below $4,000 briefly before rebounding to around $4,032 by midday Thursday, while silver steadied near $48.28.
The abrupt reversal came amid a broader market reassessment after months of relentless gains driven by geopolitical tensions, persistent inflation fears, and central bank buying. Gold has surged 54% year-to-date, buoyed by safe-haven demand amid U.S. election uncertainties and conflicts in the Middle East and Ukraine. Silver, with its dual role as an industrial metal, benefited from green energy demand but amplified the rally’s volatility.
“This was a classic profit-taking event after an overstretched rally,” said John Hardy, head of commodity strategy at Saxo Bank. “Retail investors piled in at the top, and now we’re seeing the ‘tourists’ exit stage left. But the fundamentals—de-dollarization trends and fiscal deficits—remain intact for the long term.”
The timing coincided with optimism over U.S.-China trade talks, which eased fears of escalation and strengthened the dollar, pressuring dollar-denominated commodities. U.S. inflation data due Friday could further influence sentiment, with softer readings potentially signaling fewer Federal Reserve rate cuts and diminishing gold’s appeal as an inflation hedge.
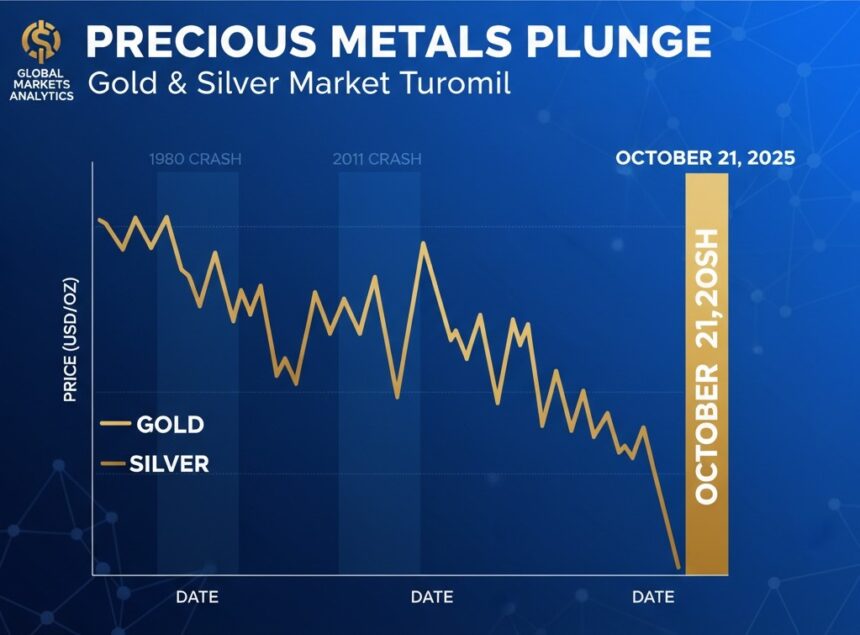
To contextualize the turmoil, analysts are drawing parallels to previous precious metals crashes, where euphoria gave way to capitulation. The most infamous remains the 1980 “Silver Thursday” crisis, when brothers Nelson and William Hunt attempted to corner the silver market, driving prices from $6 to nearly $50 per ounce. Regulators’ intervention triggered a 50% plunge in days, wiping out $1.7 billion in Hunt family wealth and leading to margin calls that rippled through Wall Street. Gold, which had spiked to $850 amid inflation and oil shocks, halved in value within months, exacerbated by aggressive Fed rate hikes under Paul Volcker.
A more recent echo occurred in 2011-2013, when gold peaked at $1,920 amid post-financial crisis quantitative easing and European debt woes, only to crater 45% to $1,050 by mid-2013. Silver mirrored the descent, falling 70% from $49 to $14. The trigger? A shift to risk-on assets as U.S. economic recovery gained traction, coupled with ETF outflows and reduced central bank purchases. “That era’s crash was fueled by leveraged speculation, much like today’s retail frenzy via apps and social media,” noted Rhona O’Connell, precious metals analyst at StoneX. “But unlike 2011, current holdings are more physical and institutionally backed, providing a floor.”
The 2008 global financial crisis offers another lens. Gold initially dropped 30% from $1,000 to $700 as investors liquidated assets for cash amid Lehman Brothers’ collapse. Yet it rebounded spectacularly, tripling in value by 2011 as a haven. Silver, more cyclical, fell 60% but recovered on industrial rebound. “Crashes in precious metals often precede broader economic stress, but they also signal buying opportunities,” O’Connell added.
Data underscores the scale of this week’s event. The World Gold Council reported central banks added a record 1,037 tonnes in 2024, with emerging markets like China and India leading. Exchange-traded funds saw $2.5 billion in inflows last month alone. Yet the COMEX gold futures open interest hit multi-year highs, hinting at overcrowding.
| Precious Metal | Peak Price (Oct 2025) | Drop on Oct 21 | Current Price (Oct 23) | YTD Gain |
|---|---|---|---|---|
| Gold | $4,381/oz | -6.3% | $4,032/oz | +54% |
| Silver | $54/oz | -8.7% | $48.28/oz | +112% |
(Source: Kitco, Bloomberg; prices as of 12:00 UTC Oct 23)
Will history repeat? Pessimists point to overbought conditions—gold’s 14-day relative strength index hit 85 last week, a level preceding 80% of major pullbacks since 2000. A stronger U.S. economy or resolved geopolitics could extend the correction to 10-15%, per JPMorgan estimates.
Optimists, however, see this as a healthy reset. “Silver and gold are no longer overbought but remain under-owned by institutions,” said Kitco’s Jim Wyckoff. Long-term drivers—global debt at 350% of GDP and AI-fueled industrial silver demand—suggest the uptrend persists. Historical patterns show post-crash recoveries averaging 25% within six months for gold.
For investors, the implications are clear: Diversify beyond spot prices into miners or ETFs, but brace for volatility. Policymakers, too, watch closely; a sustained drop could signal cooling inflation but strain emerging market reserves.
As markets digest Thursday’s partial rebound—with gold up 1% and silver 0.5%—the question lingers: Is this a blip in a bull market, or the prelude to a 1980s-style reckoning? Only time, and tomorrow’s data, will tell.